iXyber APC Analyst
The best solution on the market for monitoring and evaluating the effectiveness of advanced management of system configurations for advanced process control (APC) at the enterprise level

What's this for



As an APC expert at the plant, I need a tool to monitor and evaluate the performance of APC systems across the units. I want to understand how effectively operators are utilizing the APC and how efficiently and reliably the system itself is performing its functions
As a Production Director, I want to understand how effectively the APC systems are performing across our plants, what tangible benefits they deliver, and how they ensure a return on investment

iXyber APC Analyst provides monitoring for Advanced Process Control systems, calculates performance metrics, and ensures compliance with target values. It visualizes quality indicators through various dashboards and alerts users to any deviations
Key advantages
- Connectivity to APC software from any vendor via OPC DA, OPC UA, and WEB API protocols — integrating all plant-wide APC systems into a unified monitoring environment;
- Pre-configured metrics and dashboards;
Ability to edit and add custom metrics and screens; - Configurable user events, user notifications, ability to automate business processes for APC performance analysis;
- Automatic configuration reading for APC systems based on iXyber APC, Honeywell APC, and Yokogawa PACE;
- Co-deployment with other application modules iXyber Platform (APC Runner, PID Analyst, AE Analyst, Asset Analyst etc.);
- Deployment at the APC server level, plant level, or corporate level.



Unit-level APC monitoring
Aggregates APC performance metrics for all applications: multivariable controllers (MPC) and virtual analyzers (Soft Sensors) across the entire process unit.
Dashboard
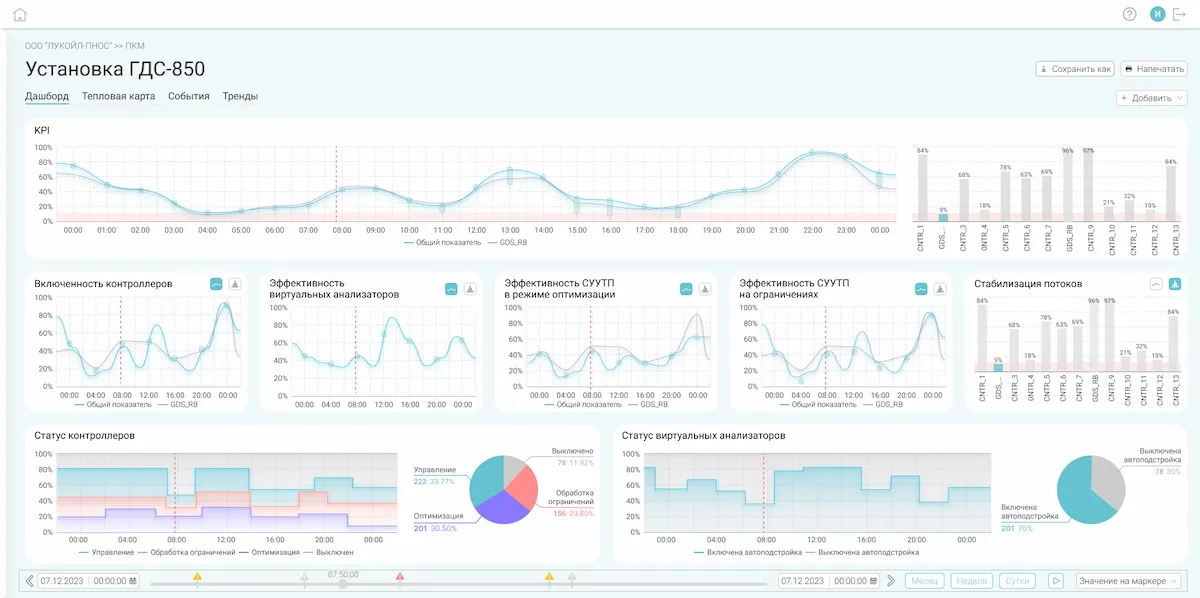

- Key metrics per controller and weighted average across all controllers:
- overall;
- enabled/disabled state of controller;
- virtual analyzer efficiency;
- optimization mode operation;
- controller constraint operation.
- Controller and soft sensor status statistics

- Key metrics per controller and weighted average across all controllers:
- overall;
- enabled/disabled state of controller;
- virtual analyzer efficiency;
- optimization mode operation;
- controller constraint operation.
- Controller and soft sensor status statistics
Heatmap
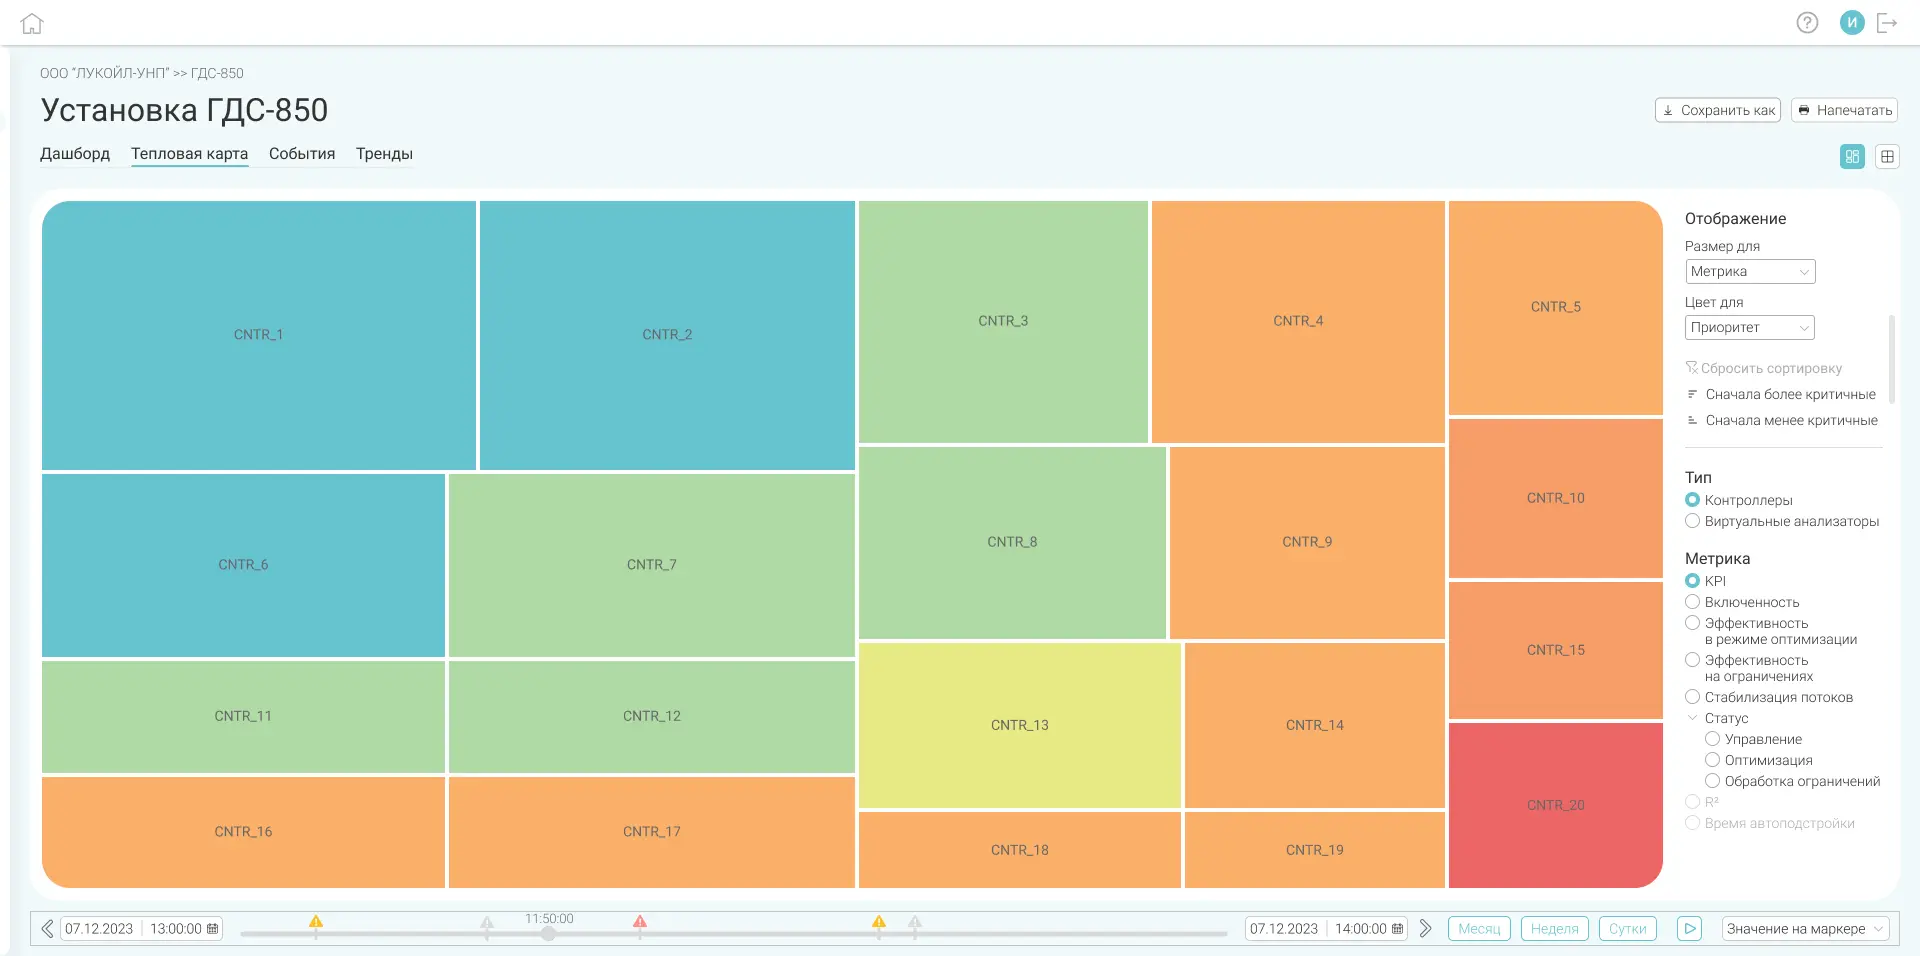
 Table view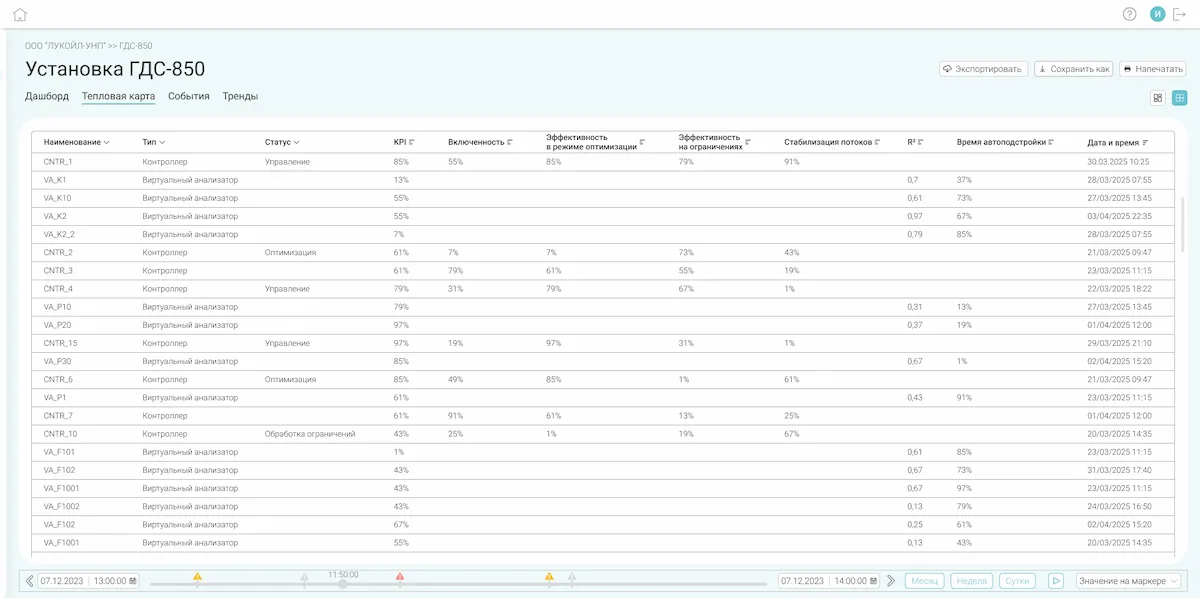
- Heatmaps for controllers and soft sensors;
- Color and size encoding;
- Sorting and filtering by metrics and statuses;
- Export data from table view to CSV format.
- Heatmaps for controllers and soft sensors;
- Color and size encoding;
- Sorting and filtering by metrics and statuses;
- Export data from table view to CSV format.

Multivariable Controller Monitoring
Monitoring and performance assessment of individual MPCs.
Dashboard
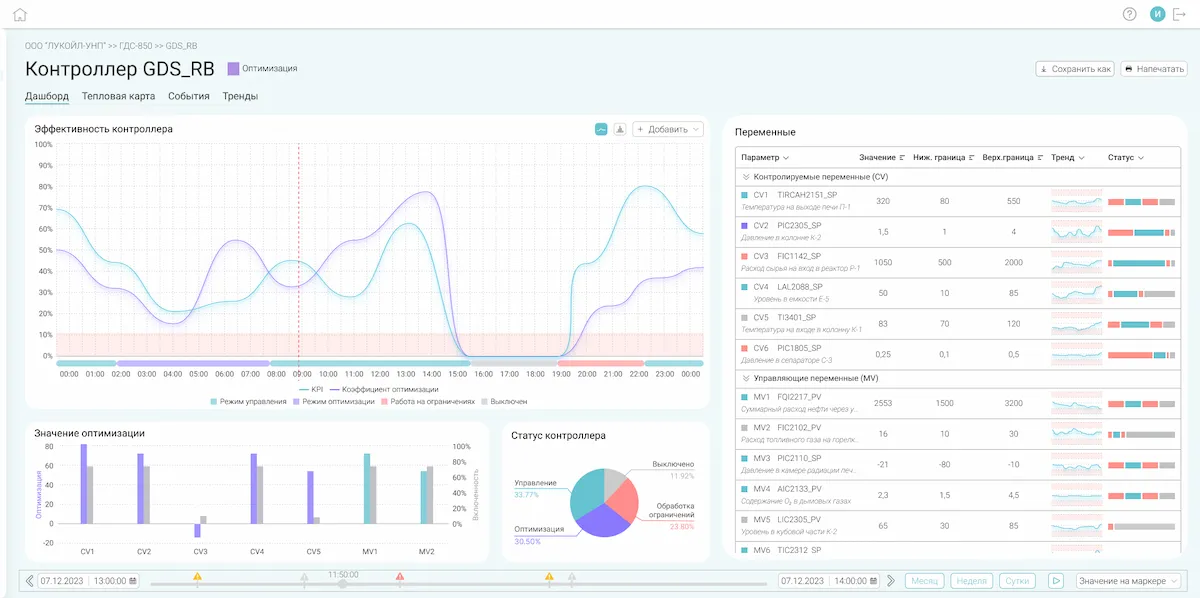

- Controller efficiency metrics:
- overall;
- enabled/disabled state of controller;
- virtual analyzer efficiency;
- optimization mode operation;
- controller constraint operation.
- Controller and variable statuses:
- controller modes;
- controller variables;
- variables in optimization.
- Controller efficiency metrics:
- overall;
- enabled/disabled state of controller;
- virtual analyzer efficiency;
- optimization mode operation;
- controller constraint operation.
- Controller and variable statuses:
- controller modes;
- controller variables;
- variables in optimization.
- Controller efficiency metrics:
- overall;
- enabled/disabled state of controller;
- virtual analyzer efficiency;
- optimization mode operation;
- controller constraint operation.
- Controller and variable statuses:
- controller modes;
- controller variables;
- variables in optimization.
Heatmap
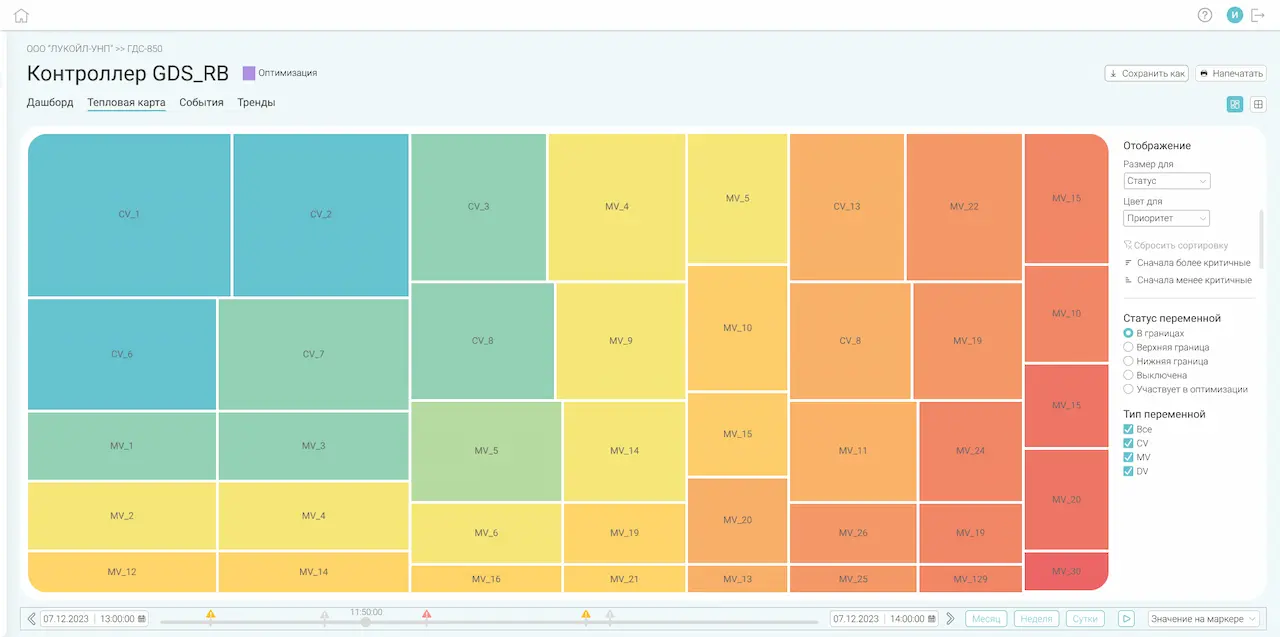 Table view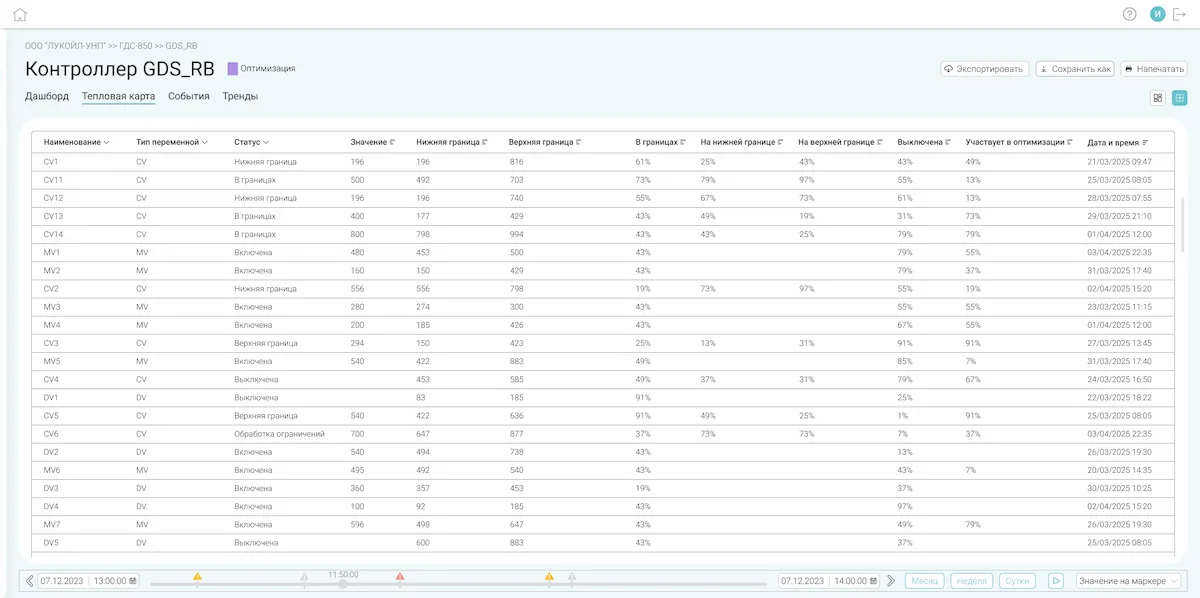
- Color and size encoding;
- Sorting and filtering by metrics and statuses;
- Export data from table view to CSV format.
- Color and size encoding;
- Sorting and filtering by metrics and statuses;
- Export data from table view to CSV format.

Virtual Analyzer Monitoring
Monitoring and performance assessment of individual soft sensors.
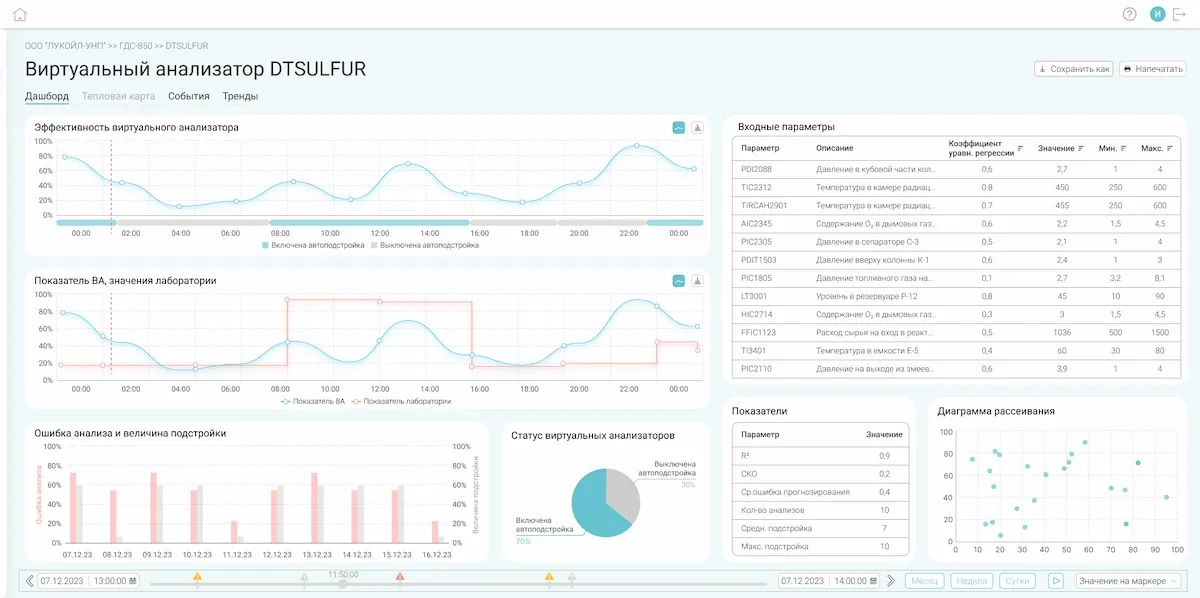
- VA efficiency;
- VA status;
- Deviation from lab;
- VA model quality.

Events, Trends, Data Export
Viewing and analysis of events and historical trends; exporting monitoring data for external processing.
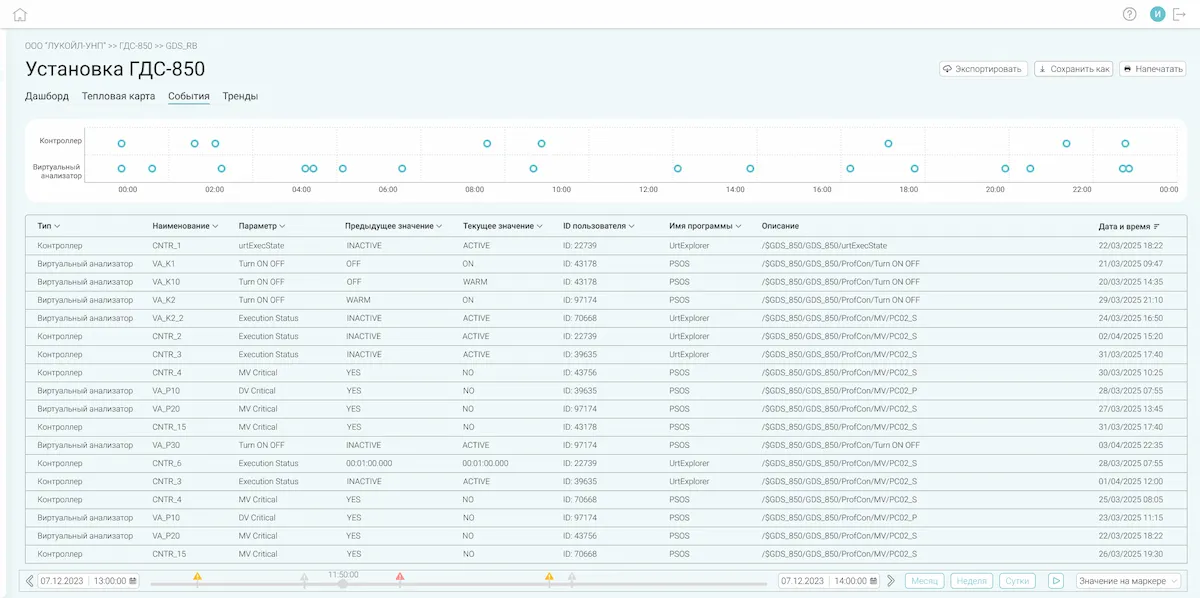
- Events across all APC applications: System events, User events;
- Exporting event logs and trend data to CSV format.
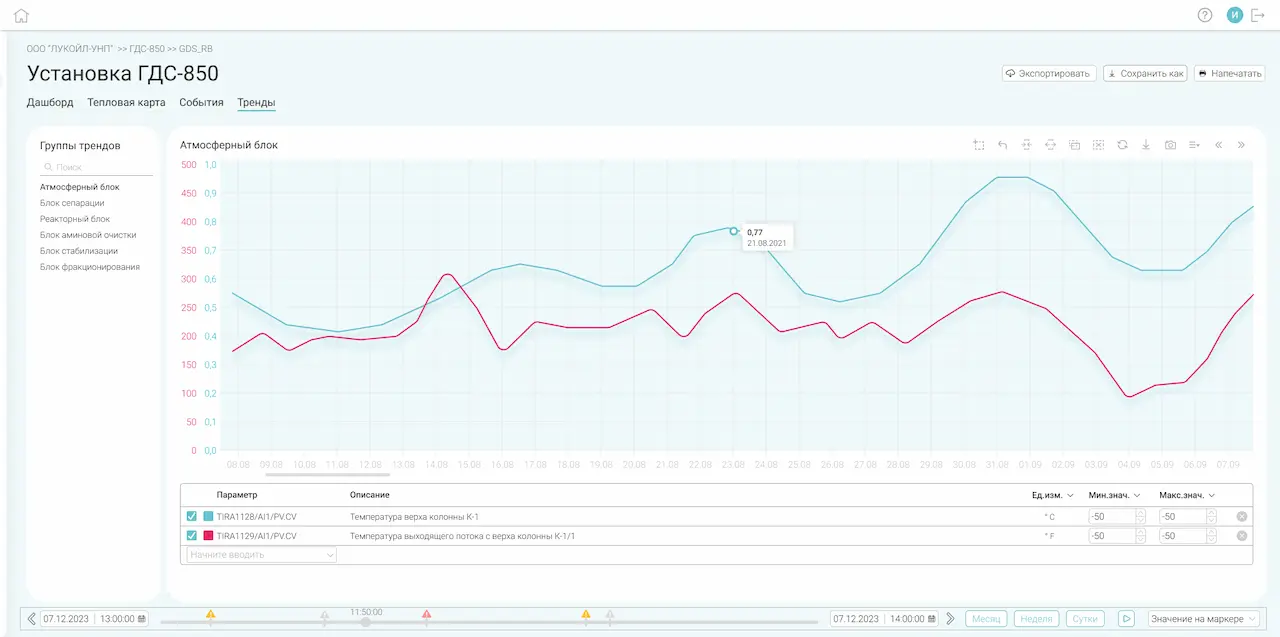
- Historical Trends:
- Pre-configured and user-defined trend groups.
- Events across all APC applications: System events, User events;
- Exporting event logs and trend data to CSV format.
Case studies
Loading...